Support and resistance are fundamental concepts in technical analysis. Support and resistance represent key price levels where a cryptocurrency’s price tends to stall, reverse, or experience increased buying or selling pressure. These levels helps in all types of trading such as Short term trading including Day trading, Scalping, Swing trading & Long term trading.
Support Levels: These are price levels where the demand for a particular cryptocurrency is strong enough to prevent the price from falling further. Traders often look for support levels to potentially enter a trade or place stop-loss orders.
Resistance Levels: Conversely, resistance levels are price points where the supply of a cryptocurrency is ample enough to halt its upward movement. These levels may present opportunities for traders to take profits or reconsider their positions.
For a Trader, It’s important to know how to read Candlestick Charts.
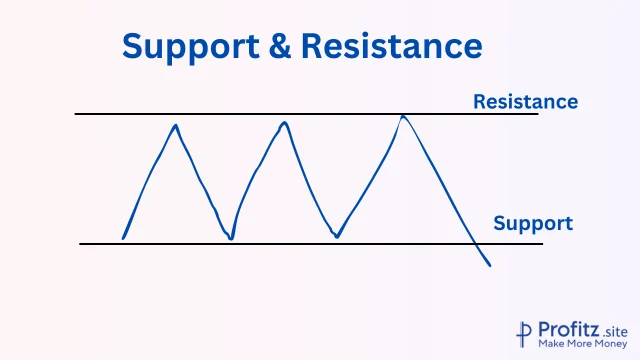
Understanding Support
Definition of Support in Trading
In trading, support represents a price level at which an asset tends to stop falling, showing a reluctance to decrease further in value. It’s essentially a floor for the price, where demand for the asset increases, surpassing selling pressure and preventing it from declining.
Types of Support
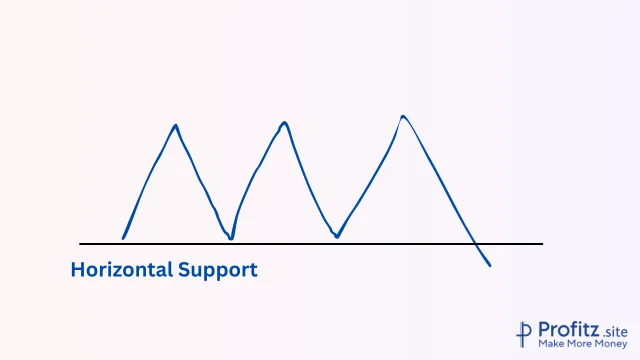
Horizontal Support
Easily identifiable levels where the price consistently reverses or consolidates.
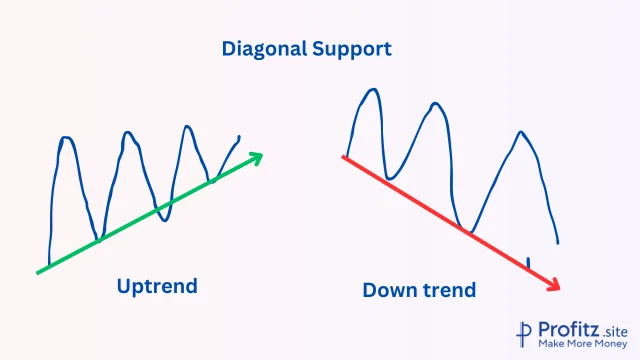
Diagonal Support
Trendlines that connect higher lows, indicating an upward trend’s support level.
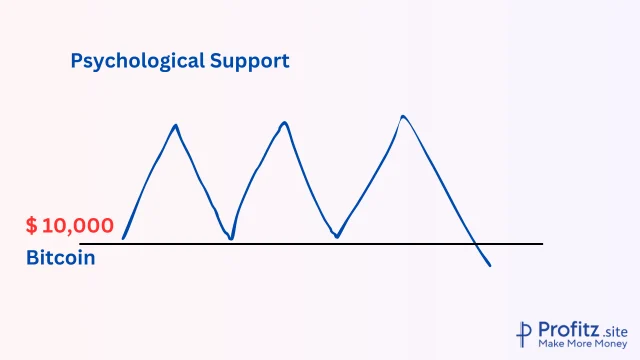
Psychological Support
Price levels that are not precisely defined by technical analysis but are based on psychological thresholds (e.g., round numbers like $10,000 for Bitcoin).
Factors Influencing Support Levels in the Crypto Market
1. Volume
Higher trading volumes often validate support levels, suggesting increased market interest at those price points.
2. Historical Data
Previous price action at specific levels can establish strong support if the price has bounced off those levels multiple times in the past.
3. Market Sentiment
Positive news or a bullish sentiment can reinforce support levels as more buyers enter the market.
Examples of Support Levels in Crypto Charts
– Bitcoin at $30,000: During a recent market correction, Bitcoin consistently found support around the $30,000 mark, showing multiple instances of price reversals.
– Ethereum’s Trendline Support: Ethereum’s upward trendline from the lows of a recent period forms a reliable diagonal support, demonstrating the strength of the ongoing uptrend.
Understanding support levels involves analyzing historical price data, trading volumes, and market sentiment to identify key levels where buyers tend to step in, providing a foundation for the asset’s price to bounce back from downward movements.
Understanding Resistance
Definition of Resistance in Trading
In trading, resistance refers to a price level at which an asset tends to encounter selling pressure, preventing its price from rising further. It signifies a point where the concentration of sellers surpasses buyers, causing the price to stall or reverse its upward momentum.
Types of resistance
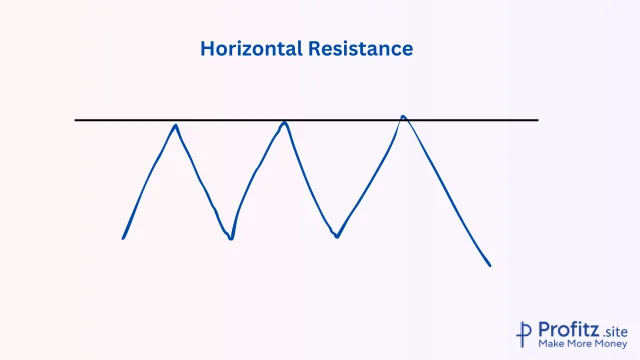
Horizontal Resistance
Occurs when the price repeatedly fails to break above a specific horizontal level.
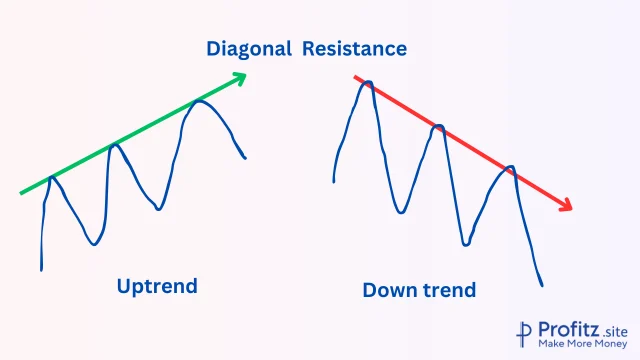
Diagonal Resistance
Forms when the price moves within a sloping trendline, acting as a barrier to upward movement.
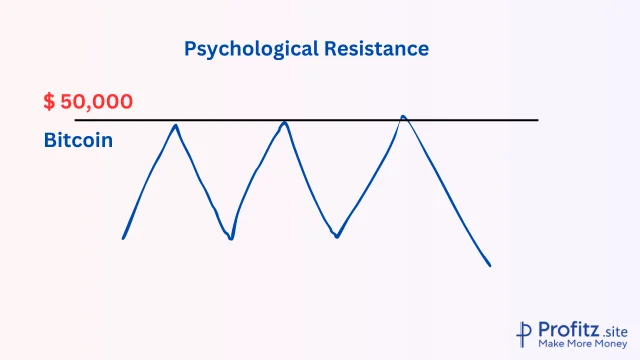
Psychological Resistance
Arises at round price levels (e.g., $10,000, $50,000), often influencing trader behavior due to perceived significance.
Factors influencing resistance levels in the crypto market
Volume
High trading volume near resistance often indicates increased selling pressure.
Historical Data
Previous price points where the asset struggled to advance can become future resistance levels.
Market Sentiment
Negative news or market sentiment can strengthen resistance as sellers become more active, impeding price increases.
Examples of resistance levels in crypto charts
Bitcoin (BTC) at $60,000: During a specific period, BTC consistently failed to breach the $60,000 mark, forming a horizontal resistance level that took multiple attempts to break.
Suggestion
Charts frequently shows similar pattern – Uptrend- some Lagging ( where price bounces between support & resistance ) – Breakout ( uptrend / down trend)- Lagging – Breakout – then Repeat. If you can identify these patterns, then it’s easy to trade.
Importance of Support and Resistance in Crypto Trading
Support and resistance levels play a pivotal role in guiding traders’ decisions and strategies in the volatile world of cryptocurrency. Here’s a closer look at their significance:
A. Role of Support and Resistance in Making Trading Decisions
Support and resistance act as crucial indicators for traders, providing key insights into potential price movements. They represent psychological levels where the market tends to react, either by reversing trends or by experiencing temporary pauses in price movement.
Support: It signifies a price level where buying interest is strong enough to halt or prevent a decline in the asset’s value.
Resistance: It indicates a level where selling pressure is sufficient to stop or prevent an increase in the asset’s value.
B. How Traders Use These Levels to Set Entry and Exit Points
Support and resistance levels are instrumental in setting precise entry and exit points for trades.
Entry Points: Traders often look to enter positions near support levels, anticipating a bounce in price. This strategy allows for buying assets at potentially lower prices.
Exit Points: Resistance levels can serve as potential exit points. Traders might consider selling their assets when prices reach these levels, expecting a downward reversal or a temporary stall.
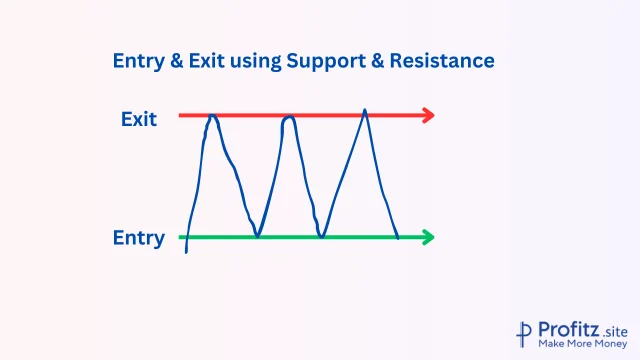
By strategically placing orders around these levels, traders aim to capitalize on potential price movements and minimize risks.
Tools and Techniques to Identify Support and Resistance
Overview of Technical Indicators
In crypto trading, various technical indicators aid in identifying and confirming support and resistance levels:
Moving Averages
These indicators smooth out price data to identify trends and potential support or resistance areas. Common ones include the Simple Moving Average (SMA) and the Exponential Moving Average (EMA).
Fibonacci Retracement
Based on Fibonacci ratios, this tool helps identify potential support and resistance levels by tracing the levels where a retracement might occur after a price move.
Pivot Points
These are calculated levels that indicate potential support and resistance based on the previous day’s high, low, and close.
Bollinger Bands
Consisting of a moving average and upper/lower bands representing standard deviations, Bollinger Bands help identify volatility and potential areas of support and resistance.
Volume Profile
Analyzing volume at different price levels helps identify significant support and resistance zones where substantial trading activity occurred.
Manual Identification Techniques for Support and Resistance Levels
While technical indicators offer valuable insights, manual identification remains a critical skill for traders:
Horizontal Lines
Identifying significant price levels where the price historically struggled to move above (resistance) or below (support).
Trendlines
Drawing lines connecting consecutive highs or lows to establish potential areas of support or resistance, especially in trending markets.
Psychological Levels
Recognizing round numbers or psychologically significant price points where buying or selling pressure tends to occur.
Suggestion
Combine Support & Resistance with the Indicators for the best Accuracy. Combining these tools for your success has been discussed in detail below.
Strategies for Trading with Support and Resistance
Breakout and Bounce Strategies
Support and resistance levels often serve as indications of potential breakout or bounce points in the market.
1. Breakout Strategy
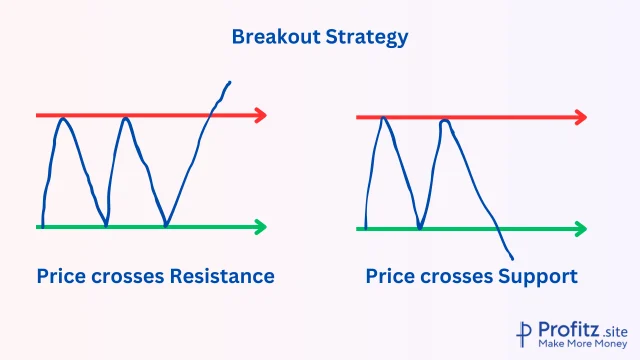
Breakouts occur when the price moves above resistance or below support, indicating a potential shift in trend.
Execution: Traders might wait for confirmation, such as increased volume or sustained price movement beyond the level, before entering a trade.
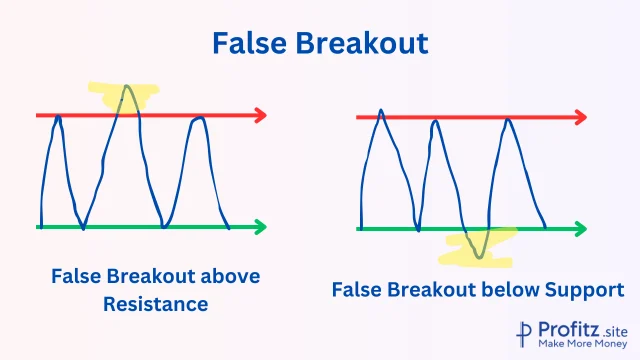
False breakouts are common, so using additional indicators or waiting for strong confirmation is advisable.
2. Bounce Strategy
Bounces happen when the price reverses direction at support or resistance levels, rather than breaking through.
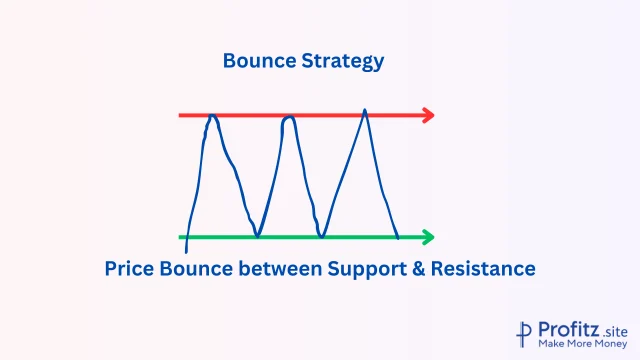
Execution: Traders might look for candlestick patterns or price rejections at these levels before entering a trade.
Considerations: Confirmation and patience are key to avoiding mistimed entries.
Risk Management Techniques when Trading around These Levels
Managing risk is crucial when utilizing support and resistance in trading strategies.
1. Setting Stop Loss
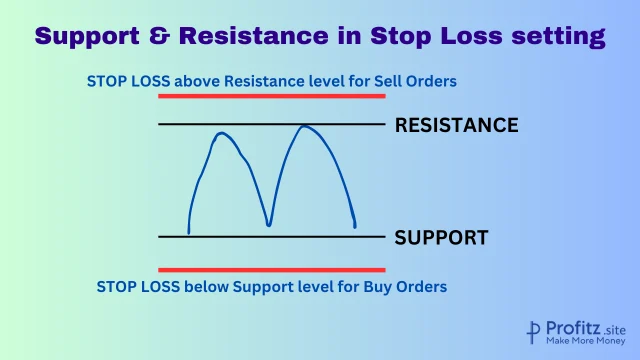
Placement: Stops can be placed slightly below support or above resistance levels, allowing for some price fluctuation without invalidating the trade.
Adaptation: As the trade progresses, adjusting stop losses to lock in profits or mitigate losses is essential.
2. Position Sizing
Calibration: Adjusting position sizes based on the distance between entry and support/resistance levels helps control risk.
Assessment: Assessing the potential reward-to-risk ratio before entering a trade assists in making informed decisions.
Suggestion
By predicting Support & Resistance- your trading career moves to better success. Learn in detail & try to predict in real market in DEMO accounts. After months of practice start investing with small amounts of money & gradually increase.
Tips for Combining Support and Resistance with Other Indicators for Better Decision-Making
1. Moving Averages
Confirmation: Confirm support or resistance levels with moving averages to validate the strength of these zones.
Cross-Verification: Look for convergence/divergence between moving averages and support/resistance levels for added confirmation.
2. Relative Strength Index (RSI) or MACD
Divergence: Check for divergences between these indicators and price action near support or resistance for potential trend reversals.
Convergence: Aligning RSI or MACD signals with these levels can strengthen entry or exit decisions.
3. Volume Analysis
Higher volume at support/resistance levels often strengthens their significance.
Volume Patterns: Look for volume patterns indicating accumulation/distribution near these levels for further confirmation.
Challenges and Limitations
False Breakouts and Breakdowns
Support and resistance levels aren’t foolproof indicators. False breakouts or breakdowns occur when prices seemingly breach these levels but quickly revert to their previous trend.
Causes: Market manipulation, sudden influx of orders, or lack of genuine momentum.
Impact: Traders might enter or exit positions prematurely, leading to losses or missed opportunities.
Mitigation: Use confirmation indicators, wait for substantial volume, or consider wider price action context before acting on apparent breakouts.
Adapting to Volatile Market Conditions
Crypto markets are notoriously volatile, making support and resistance levels susceptible to abrupt shifts.
Challenge: Rapid price fluctuations can invalidate established levels, making it challenging to rely solely on historical data.
Approach: Constantly reassess and adjust support/resistance levels based on recent market movements.
Strategy: Employ wider price ranges or dynamic indicators to accommodate volatility in setting these levels.
Overcoming Psychological Biases When Trading with These Levels
Traders often fall prey to psychological biases when interpreting support and resistance.
Biases: Over-reliance on specific levels, emotional attachment to positions, or confirmation bias.
Impact: Could lead to impulsive decisions, ignoring contrary signals, or holding onto losing positions.
Mitigation
- Maintain discipline by following a predefined trading plan.
- Utilize risk management techniques like stop-loss orders to limit losses.
- Continuously reassess market data rather than sticking rigidly to preconceived notions.
Conclusion
Support & Resistance price levels indicate where buying and selling pressures are concentrated, offering valuable insights for traders. Support represents a price floor, while resistance acts as a ceiling, helping traders make informed decisions about entry, exit, and risk management.
Understanding support and resistance is not merely about recognizing lines on a chart; it’s about interpreting market psychology and dynamics. Embracing continuous learning, practicing analysis, and honing these skills through hands-on experience will refine your ability to navigate the crypto markets effectively.
Final Thoughts
While support and resistance are potent tools, they’re part of a larger toolkit for trading success. Combining these levels with other indicators, risk management strategies, and a keen awareness of market news and sentiment can amplify their effectiveness. Remember, successful trading involves a blend of technical analysis, fundamental understanding, and emotional discipline.
Mastering the art of identifying and utilizing support and resistance levels can significantly enhance your trading success in the crypto space. Stay curious, keep practicing, and adapt your strategies to market shifts for a fulfilling and potentially rewarding trading journey.
Happy Trading!
