Candlestick chart, with its visually appealing and easy-to-interpret nature, has become a cornerstone of technical analysis for traders worldwide. By grasping the language of candlestick chart patterns, traders gain an edge in anticipating potential market reversals, continuations, or indecision points.
In the subsequent sections, we’ll delve deeper into the anatomy of candlestick chart, explore various patterns, and uncover their significance in decoding market movements.
What is a Candlestick Chart?
Candlestick chart are a visual representation of price movements in financial markets, commonly used by traders to analyze and interpret market data. Unlike traditional line charts, candlestick chart provide more comprehensive information, offering insights into the market sentiment and price action over a specific period.
Suggestion
The Best Mentor for you in trading is Candlestick Chart. It’s up to you, to understand your Mentor.
Let’s dive to understand it further.
Components of a Candlestick
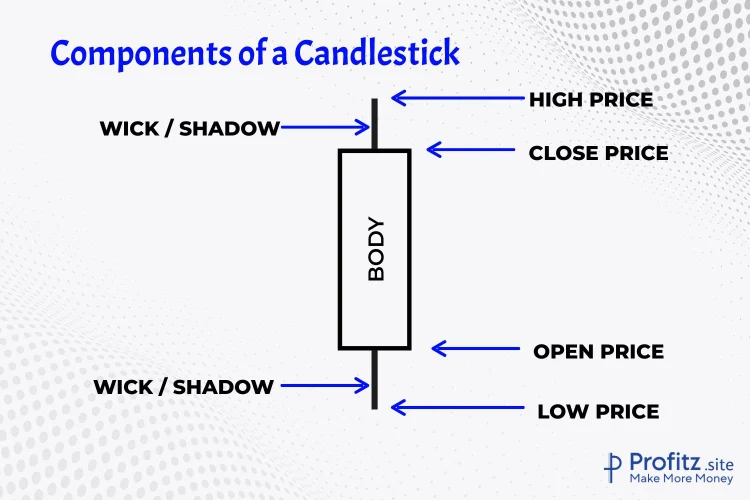
1. Body
- The rectangular-shaped area between the open and close prices for a given time period.
- A filled (or solid) body represents a lower close than the open (bearish sentiment).
- An empty (or hollow) body represents a higher close than the open (bullish sentiment).
2. Wick/Shadow
- The thin lines (upper and lower) extending from the body of the candlestick.
- They indicate the price range between the highest and lowest traded prices within the chosen timeframe.
- The upper shadow represents the highest price, while the lower shadow represents the lowest price.
3. Open, High, Low, Close (OHLC)
Open: The price at the beginning of the selected period.
High: The highest price reached during the period.
Low: The lowest price reached during the period.
Close: The price at the end of the selected period.
Explanation of Bullish and Bearish Candles
Bullish Candle
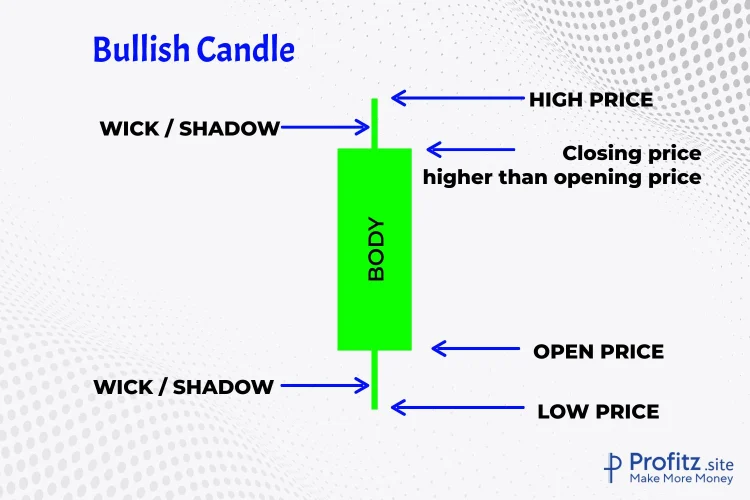
- A bullish candlestick forms when the closing price is higher than the opening price.
- The body is typically hollow or white, indicating upward price momentum.
- Long lower shadows may indicate temporary downward movement but ultimately closing higher.
Bearish Candle
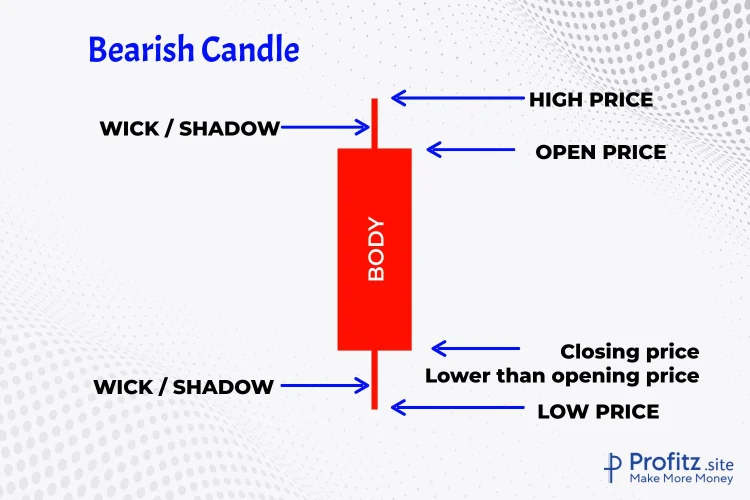
- A bearish candlestick forms when the closing price is lower than the opening price.
- The body is usually filled or black, representing downward price movement.
- Long upper shadows may suggest temporary upward movement but ultimately closing lower.
Suggestion
Only 2 you can see – The Bull or the Bear. Choose it wisely. If you can choose the right one most of the time, then you Win & will make Profits. I’ll help you do that.
Importance of Candlestick Patterns
Candlestick patterns hold immense significance in the world of trading due to their ability to encapsulate market sentiment and provide crucial insights into price movements. Here’s a closer look at why traders heavily rely on these patterns for analysis and how they effectively represent market sentiment:
The significance of candlestick charts lies in their ability to showcase
Price Action: Each candle encapsulates the open, high, low, and close prices for a specific period, providing a snapshot of price action.
Market Sentiment: Different candlestick patterns reflect varying sentiments of buyers and sellers, aiding in understanding shifts in momentum.
Why Traders Use Candlestick Patterns for Analysis
1. Visual Representation: Candlestick patterns offer a visual depiction of price action over a specific period. Traders can swiftly interpret market behavior, trends, and potential reversals at a glance, making them a preferred tool for quick analysis.
2. Easy Identification of Patterns: These patterns are relatively easy to identify and understand, even for novice traders. The distinct shapes and combinations of candlesticks help traders recognize potential shifts in supply and demand dynamics.
3. Historical Significance: Candlestick patterns have a rich historical context, originating from Japanese rice traders centuries ago. Their continued relevance and proven track record in predicting price movements contribute to their credibility among traders.
4. Pattern Specificity: Different patterns signal various market sentiments, such as bullishness, bearishness, indecision, or potential trend reversals. Traders can leverage this specificity to formulate informed trading strategies.
How Patterns Represent Market Sentiment
Bullish vs. Bearish Sentiment
The shapes and formations of candlestick patterns communicate the ongoing battle between buyers and sellers. For instance, long bullish candles indicate strong buying pressure, while long bearish candles signify strong selling pressure.
Reversal and Continuation Signals
Certain patterns, like engulfing patterns or hammers, indicate potential trend reversals. Others, such as flags or pennants, suggest the continuation of prevailing trends. Understanding these patterns helps traders anticipate market movements.
Psychological Impact
Candlestick patterns reflect market psychology and emotions, encompassing fear, greed, optimism, and pessimism. For instance, doji candles, representing indecision, often precede significant market moves as traders weigh their positions.
Confirmation of Fundamental Analysis
Candlestick patterns can complement fundamental analysis by providing timely entry or exit points. When aligned with fundamental factors, these patterns enhance the conviction behind a trade decision.
Suggestion
Trading is simple than you think. Spend atleast 1 hr/day for the next 1 year -Reading, learning, practicing in your demo accounts, before investing your real money – Then you Succeed.
Single Candlestick Patterns
1. Doji
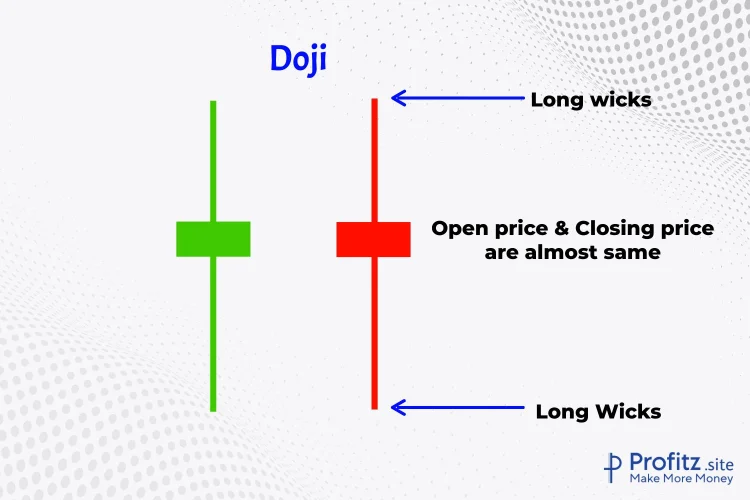
A Doji occurs when the opening and closing prices are virtually the same, resulting in a small-bodied candle with long upper and lower shadows.
Interpretation: Signifies market indecision or equilibrium between buyers and sellers. It could indicate a potential trend reversal or continuation, depending on its context within the market.
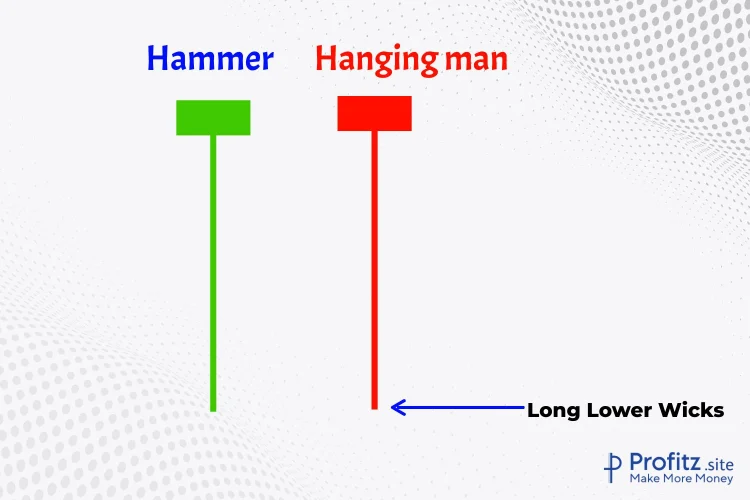
2. Hammer and Hanging Man
Hammer
A Hammer candlestick has a small body with a long lower shadow and little to no upper shadow.
Interpretation: Typically seen at the end of a downtrend, suggesting potential bullish reversal. It shows that sellers drove prices lower, but buyers pushed the price back up, often signaling a trend shift.
Hanging Man
Similar to a Hammer but occurs at the top of an uptrend, signaling a potential reversal.
Interpretation: Indicates potential weakness in an uptrend, warning of a possible trend reversal.
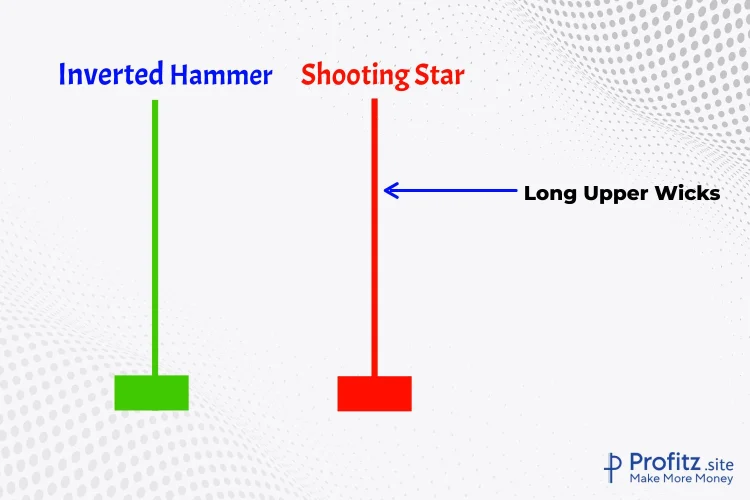
3. Shooting Star and Inverted Hammer
Shooting Star
A candlestick with a small body, a long upper shadow, and little to no lower shadow.
Interpretation: Appears at the end of an uptrend, signaling potential bearish reversal. It suggests that while the price rose significantly during the day, sellers pushed the price back down, indicating weakness.
Inverted Hammer
Similar to a Shooting Star but occurs at the bottom of a downtrend.
Interpretation: Suggests potential bullish reversal as buyers start to regain control after a downtrend. It signifies possible trend exhaustion among sellers.
Dual Candlestick Patterns
Dual candlestick patterns involve the interplay between two consecutive candles and often signal potential trend reversals or continuations.
1. Bullish Engulfing and Bearish Engulfing
Bullish Engulfing
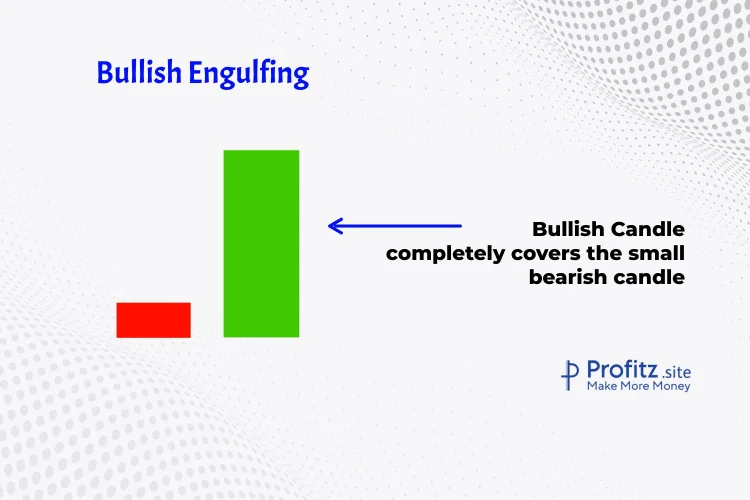
This pattern occurs in a downtrend and consists of a small bearish candle followed by a larger bullish candle that completely engulfs the previous candle’s body. It signifies a potential reversal from bearish sentiment to bullish sentiment.
Bearish Engulfing
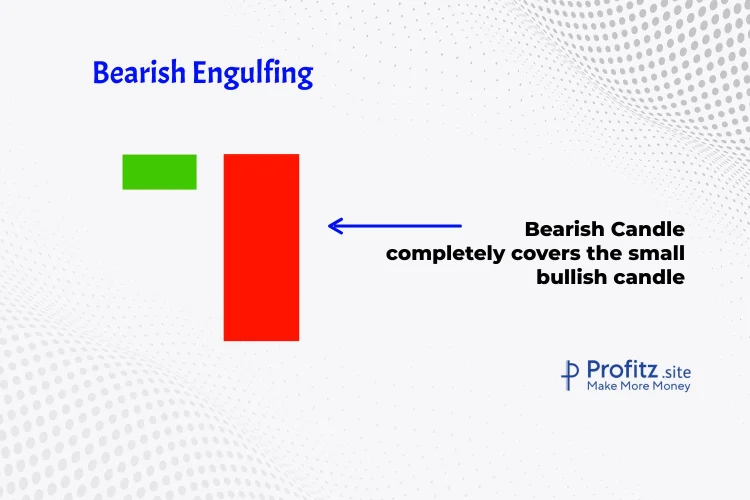
Conversely, in an uptrend, a small bullish candle is followed by a larger bearish candle that engulfs the prior candle’s body. This signals a potential shift from bullish to bearish sentiment.
These patterns are characterized by the larger candle completely overshadowing the preceding one, indicating a significant change in market sentiment.
2. Tweezer Tops and Bottoms
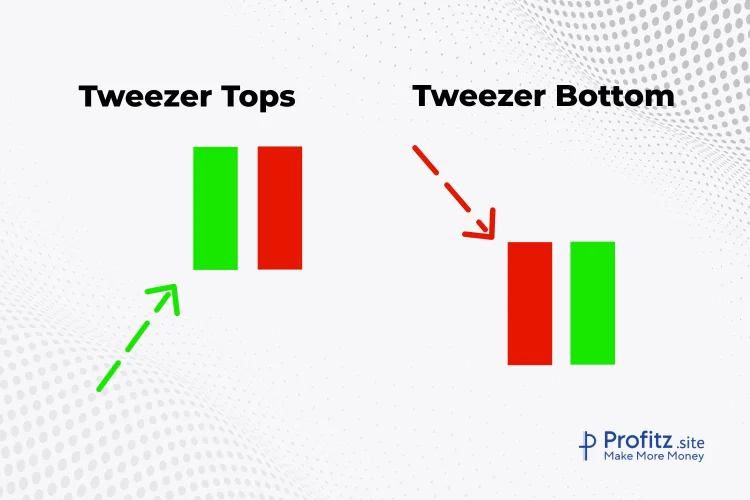
Tweezer Tops
Occurring at the end of an uptrend, tweezer tops feature two candles with almost equal highs, signifying a potential reversal. The first candle is bullish, followed by a bearish candle with the same high, forming a “top” that looks like tweezers.
Tweezer Bottoms
In a downtrend, tweezer bottoms form with two candles showing almost equal lows. A bearish candle is followed by a bullish one, creating a “bottom” resembling tweezers. This pattern suggests a possible trend reversal.
Tweezer patterns indicate a struggle between bulls and bears at a specific price level, often leading to a change in direction.
3. Piercing Pattern and Dark Cloud Cover
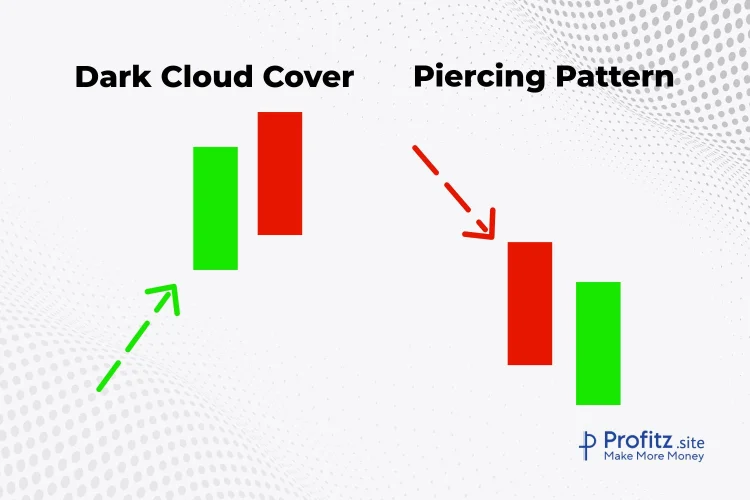
Piercing Pattern
This bullish reversal pattern forms when a downtrend is in place. It consists of a bearish candle followed by a bullish candle that opens below the previous close but closes more than halfway into the prior candle’s body. This suggests potential upward momentum.
Dark Cloud Cover
In contrast, the dark cloud cover pattern emerges in an uptrend. It starts with a bullish candle followed by a bearish candle that opens above the previous close but closes more than halfway into the prior candle’s body. This implies potential downward pressure.
Both patterns reflect a change in momentum, with the second candle indicating a potential shift against the prior trend.
Triple Candlestick Patterns
Triple candlestick patterns are formations that consist of three consecutive candles and often indicate a significant shift in market sentiment or trend reversal. Understanding these patterns can offer valuable insights into market dynamics.
1. Morning Star and Evening Star
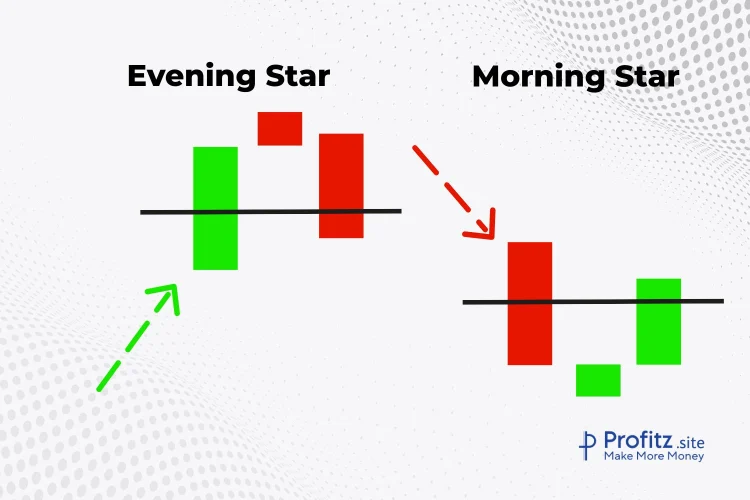
Morning Star
This bullish reversal pattern typically appears during a downtrend and consists of three candles.
Candle 1: A bearish candle that signifies the existing downtrend.
Candle 2: A smaller candle (could be bullish or bearish) that indicates indecision or a potential change.
Candle 3: A bullish candle that closes above the midpoint of the first candle, signaling a potential bullish reversal.
Evening Star
The bearish counterpart to the Morning Star, this pattern occurs during an uptrend and signals a potential reversal.
Candle 1: A bullish candle indicating the ongoing uptrend.
Candle 2: A small candle, often a doji, signaling indecision or a potential reversal.
Candle 3: A bearish candle that closes below the midpoint of the first candle, indicating a potential bearish reversal.
2. Three White Soldiers and Three Black Crows
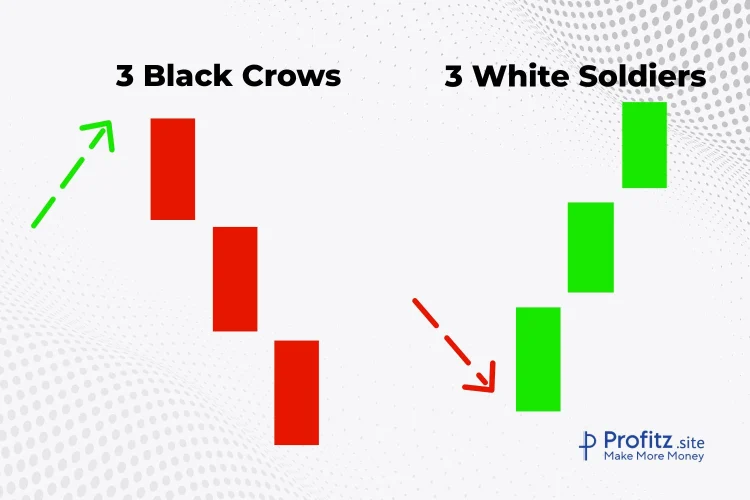
Three White Soldiers
This bullish pattern appears in a downtrend and consists of three consecutive long bullish candles.
Each candle opens higher than the previous one and closes near its high, showing increasing buying pressure and a potential trend reversal.
Three Black Crows
The bearish counterpart to Three White Soldiers, this pattern occurs in an uptrend.
It consists of three consecutive long bearish candles where each candle opens lower than the previous one and closes near its low, indicating increasing selling pressure and a potential trend reversal.
3. Abandoned Baby
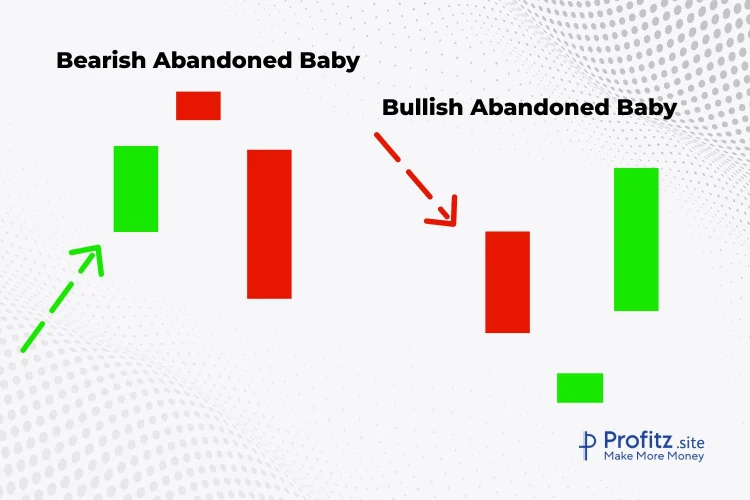
This pattern is a rare reversal pattern that indicates a trend change.
It consists of three candles:
The first and third candles are usually long and in the direction of the current trend.
The middle candle is a doji, gapping away from the preceding and following candles, signifying a period of indecision or a potential reversal.
Timeframes Suitable for Different Patterns
Short-term Patterns (Intraday Trading)
Emphasize patterns like Doji, Hammer, and Shooting Star on shorter timeframes (1-hour, 15-minute charts) for quick trades. This will be used for intraday trading.
Medium-term Patterns (Swing Trading)
Look for dual and triple candlestick patterns on daily or 4-hour charts, such as Engulfing Patterns, Three White Soldiers, etc., for swing trading strategies.
Long-term Patterns (Positional Trading)
Focus on larger timeframes (weekly, monthly) to identify major trends using patterns like Three Black Crows, Morning Star, etc., for longer-term positional trades.
Importance of Confirmation and Context
Candlestick patterns offer valuable insights, but relying solely on them can be risky. Here’s why confirmation signals and market context are crucial:
1. Confirming Signals Matter
Volume Confirmation
Validate patterns with strong trading volume. Higher volume often reinforces the significance of a pattern, indicating increased market interest and potential for a stronger move.
Additional Indicators
Use complementary technical indicators like moving averages, RSI (Relative Strength Index), or MACD (Moving Average Convergence Divergence) to confirm the signals derived from candlestick patterns. Aligning multiple indicators can strengthen the confidence in a trade setup.
2. Considering Market Context
Trend Analysis
Assess the prevailing market trend. Some patterns work best in trending markets, while others are more effective in ranging or reversal scenarios. For instance, continuation patterns like flags or pennants often appear within a trend, while reversal patterns like evening stars or hammers are more significant during trend reversals.
Timeframe Consideration
Patterns may vary in significance across different timeframes. What seems significant on a short-term chart might not hold the same weight on a longer-term one. Ensure the pattern aligns with the timeframe you’re trading in.
3. Set Stop Loss & Take Profit orders
Regardless of pattern confirmation, always implement a stop-loss strategy. This helps mitigate losses if the trade moves against your expectations. Candlestick patterns aren’t infallible, and risk management is crucial in any trading strategy.
4. Adaptability and Flexibility
Adapt to Market Conditions
Market dynamics change. A pattern that historically worked perfectly might not perform the same way in current market conditions. Be flexible and ready to adapt your strategies accordingly.
Avoid Overreliance
Don’t solely base trading decisions on a single candlestick pattern. Combine it with broader technical analysis, market news, and fundamental factors for a well-rounded perspective.
5. Continuous Learning and Practice
Practice and Experience
Mastering the interpretation of candlestick patterns takes time and practice. Engage in paper trading or utilize a demo account to apply your knowledge without risking real capital.
Keep Learning
Markets evolve, and so do trading strategies. Stay updated with the latest market trends and continuously educate yourself on candlestick patterns and their applications.
Conclusion
Candlestick chart patterns serve as a vital tool in a trader’s life showing the market sentiment and potential price movements.
Suggestion
Over a period of time, these charts & patterns will speak to you. It will covey the right market timing for you to enter & exit. You too can understand them, with PRACTICE & EXPERIENCE.
Practice Makes Proficient: Start by familiarizing yourself with these candlestick chart patterns through virtual trading or back testing strategies. Engage in regular analysis of historical charts to refine your skills.
Continuous Learning: Markets evolve, and so do trading patterns. Stay updated with new insights, refine your knowledge, and adapt your strategies accordingly.
Combine Knowledge with Experience: Theory alone isn’t enough. Apply your knowledge in real-time trading scenarios, but always remember to manage risks effectively.
Remember, proficiency in reading candlestick chart patterns takes time. Don’t be discouraged by initial challenges; instead, use them as stepping stones toward becoming a more informed and strategic trader.
Happy trading!
